
ExplainExplore
2020, 3 JunExplainExplore is a system we built as part of my PhD at the Eindhoven University of Technology in collaboration with Achmea. It aims to help data scientists to analyze and understand classification models using state of the art machine learning explanation techniques.
Explanation
Why?
Modern machine learning models are usually applied in a black-box manner: only the input (data) and output (predictions) are considered, the inner workings are considered too complex to understand.
How?
To explain a complex machine learning model, we generate a local approximation (or surrogate model) that can be easily explained.


How?
We built ExplainExplore: a new approach for analyzing and understanding classification models using state of the art machine learning explanation techniques. The system offers three perspectives:

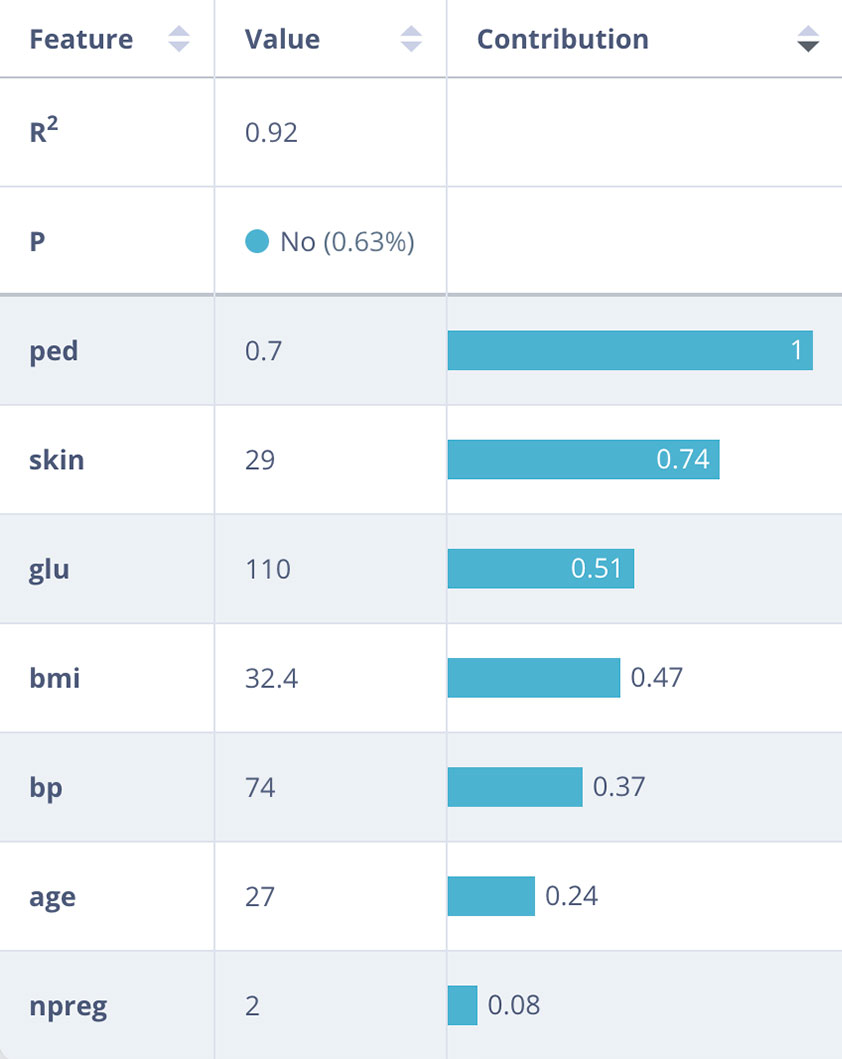
Local
Individual instances are explained using feature contribution vectors extracted from surrogate models. This shows how much every feature contributed to the prediction.
To assert the correctness of these values, information on prediction certainty (P) and surrogate fit (R2) are shown.
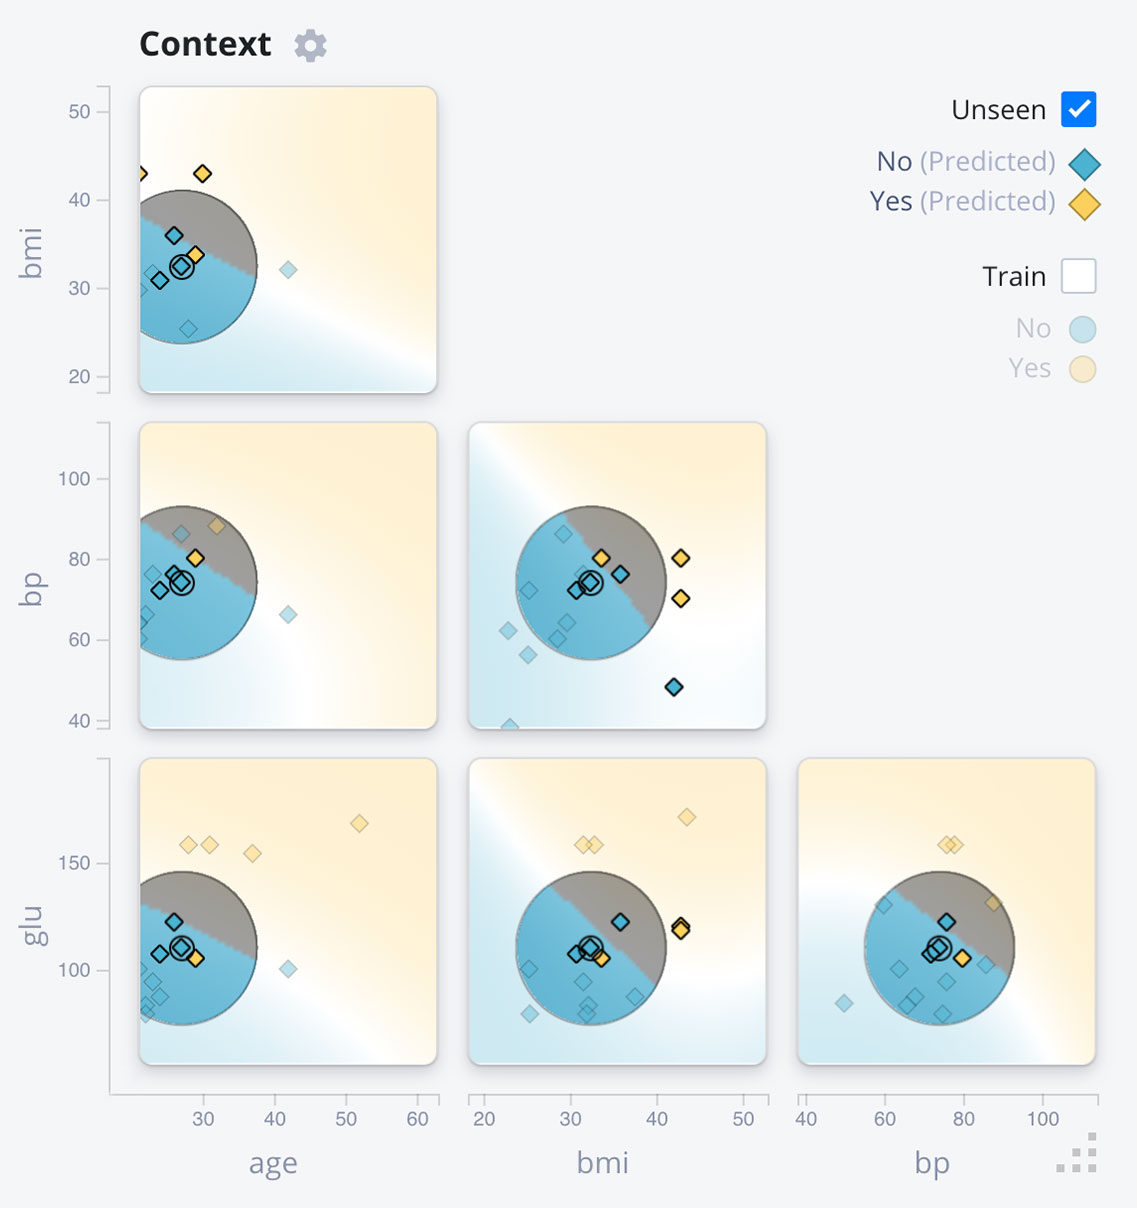
Context
In the context view, nearby data points are shown as well as the class probability of complex reference model (global) and surrogate (local). The expert can use this to assert whether the surrogate is locally faithful to the reference model, and explore the effect of instance perturbations.
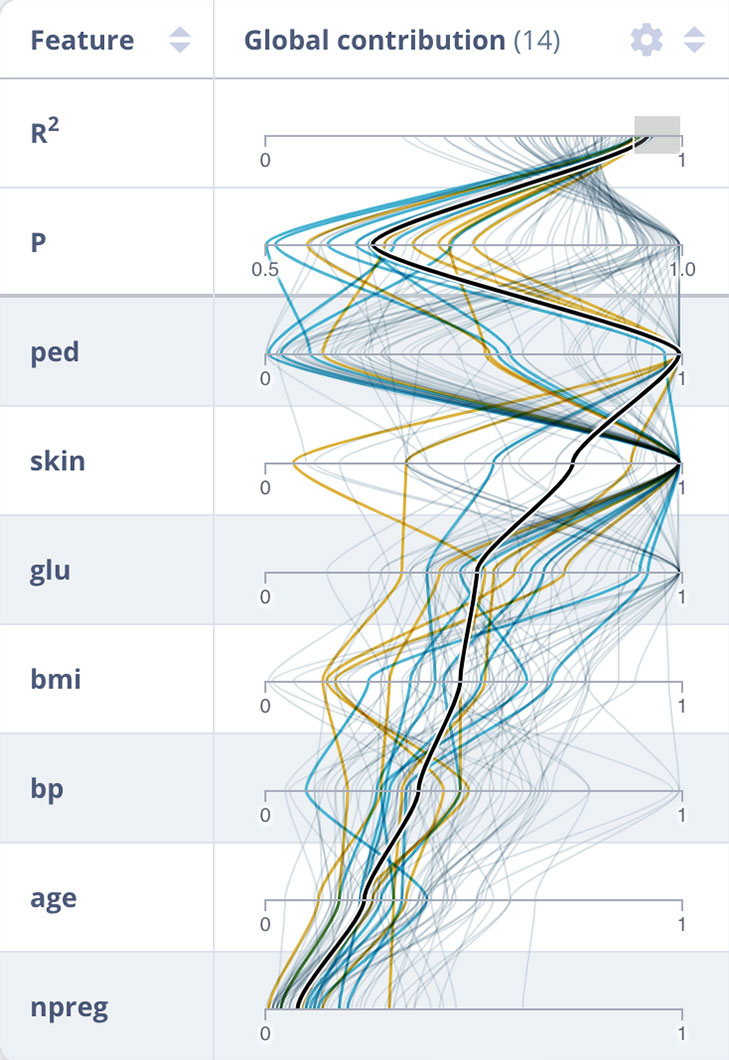
Global
The global overview combines the contribution vectors for all data in one Parallel Coordinate Plot (PCP). This helps the data scientist to identify whether the seleted instance was classified similar to other instances, and whether the model has ‘strategies’ (clusters in the contribution vectors).
For more information about ExplainExplore, you can check out the dedicated website (although the content is fairly similar, it contains links to videos and (online) demos), and the paper published in IEEE Pacific Visualization 2020.