
StrategyAtlas
2022, 27 JanStrategyAtlas is a visual analytics system to enable understanding of complex models by identifying and interpreting different model strategies.
What is a model strategy?
- model⋅strategy [ˈmɒdl ˈstratɪʤi]
-
noun
- different treatments by a machine learning model of distinct groups in the input data.


How do we find data clusters?
Traditionally, we can find clusters in the data by applying a 2D projection technique (e.g., UMAP).
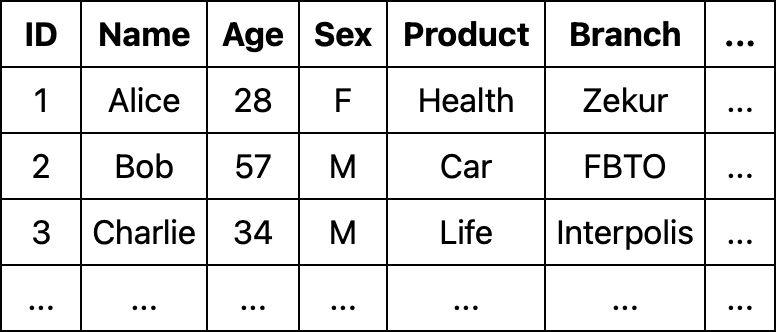
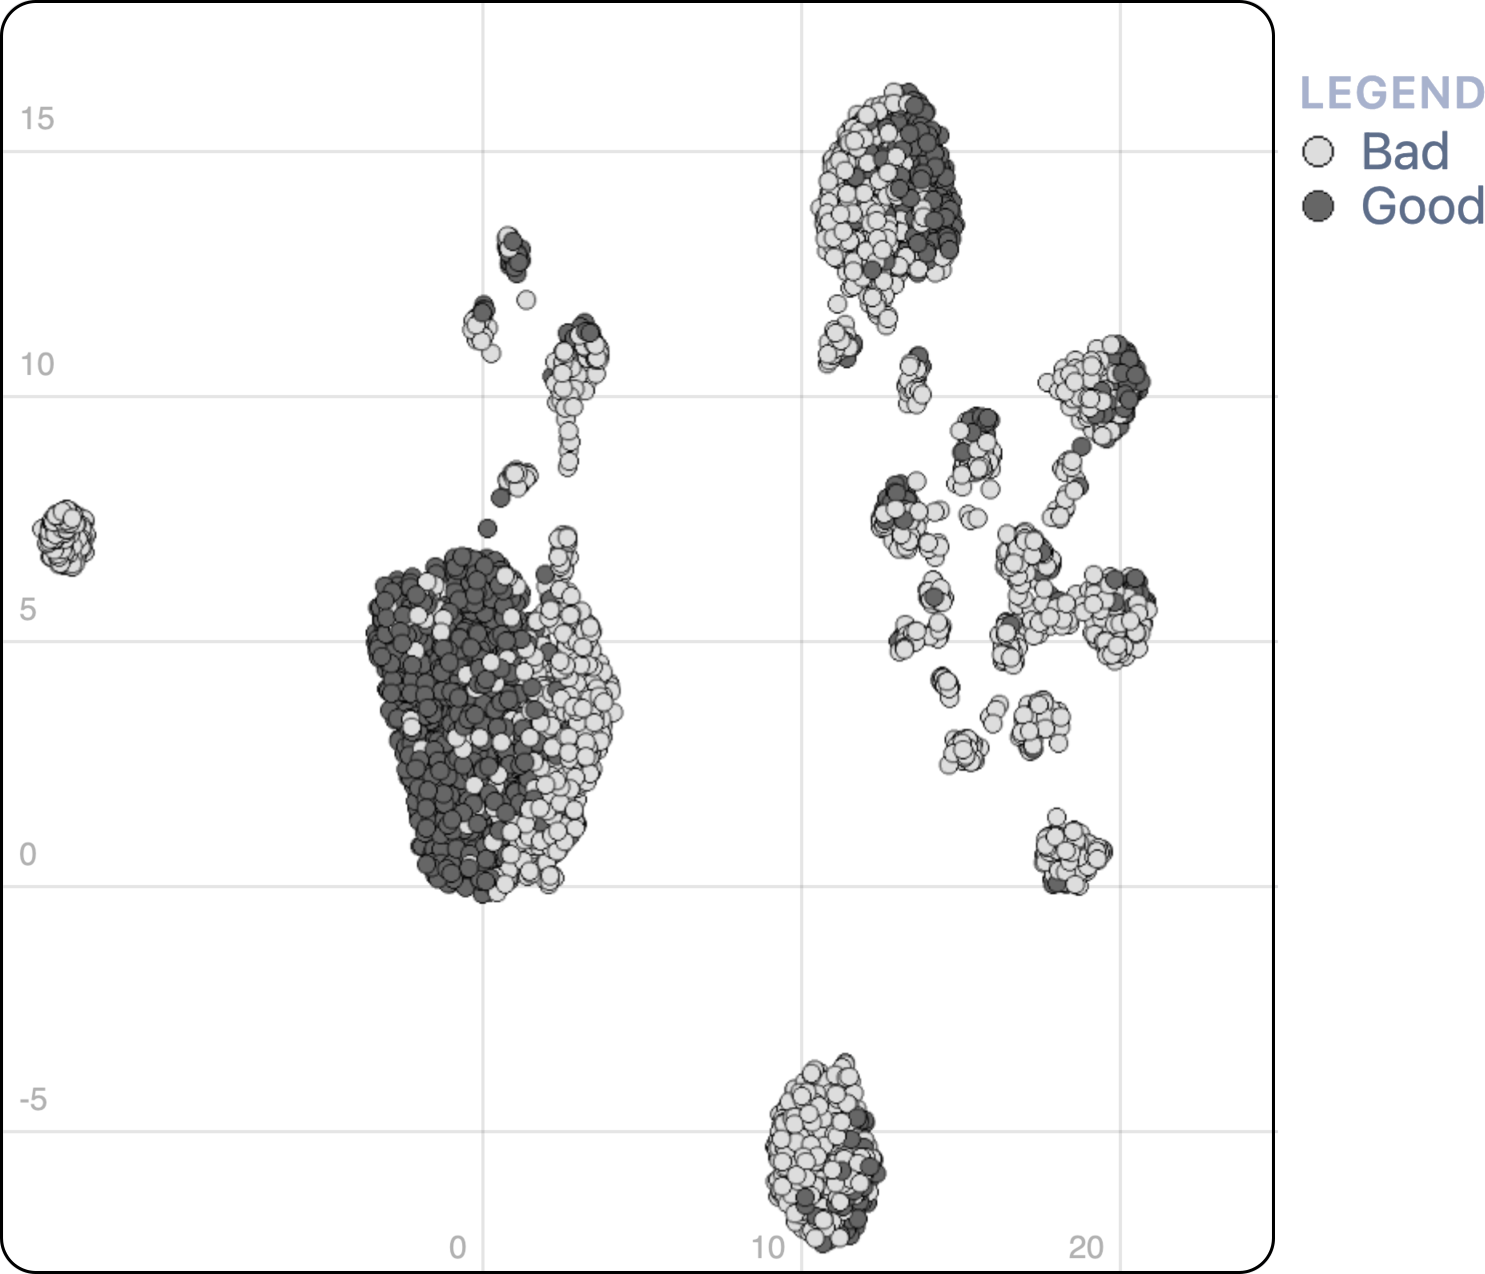
DataMap
How do we find strategy clusters?
We propose using the same approach on feature importance values to find model strategies.
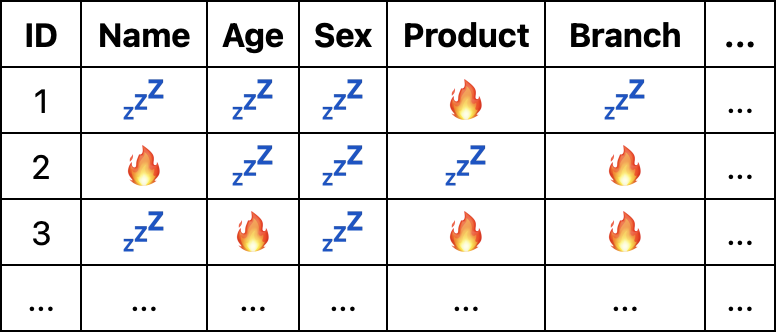
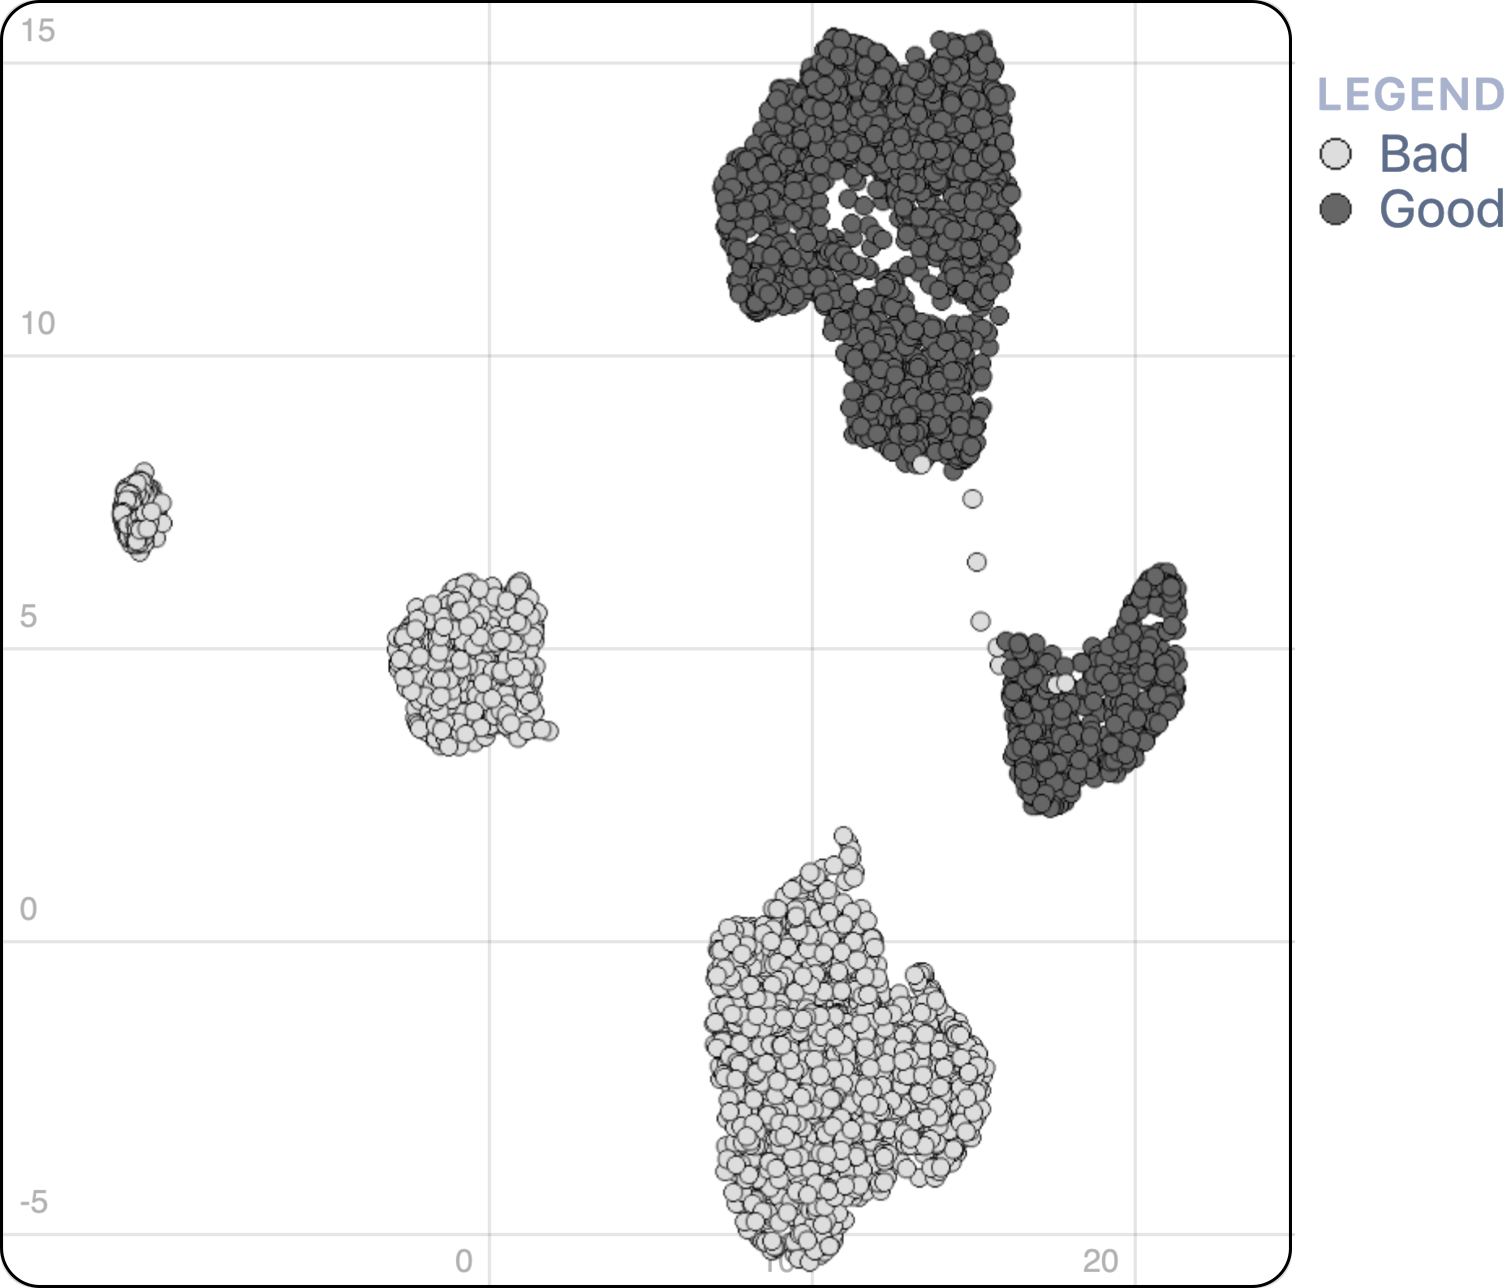
StrategyMap
What does a cluster mean?
Clusters in the StrategyMap indicate model strategies. However, what does each of these clusters mean? Our proposed visual analytics system StrategyAtlas offers three methods to identify and interpret model strategies:
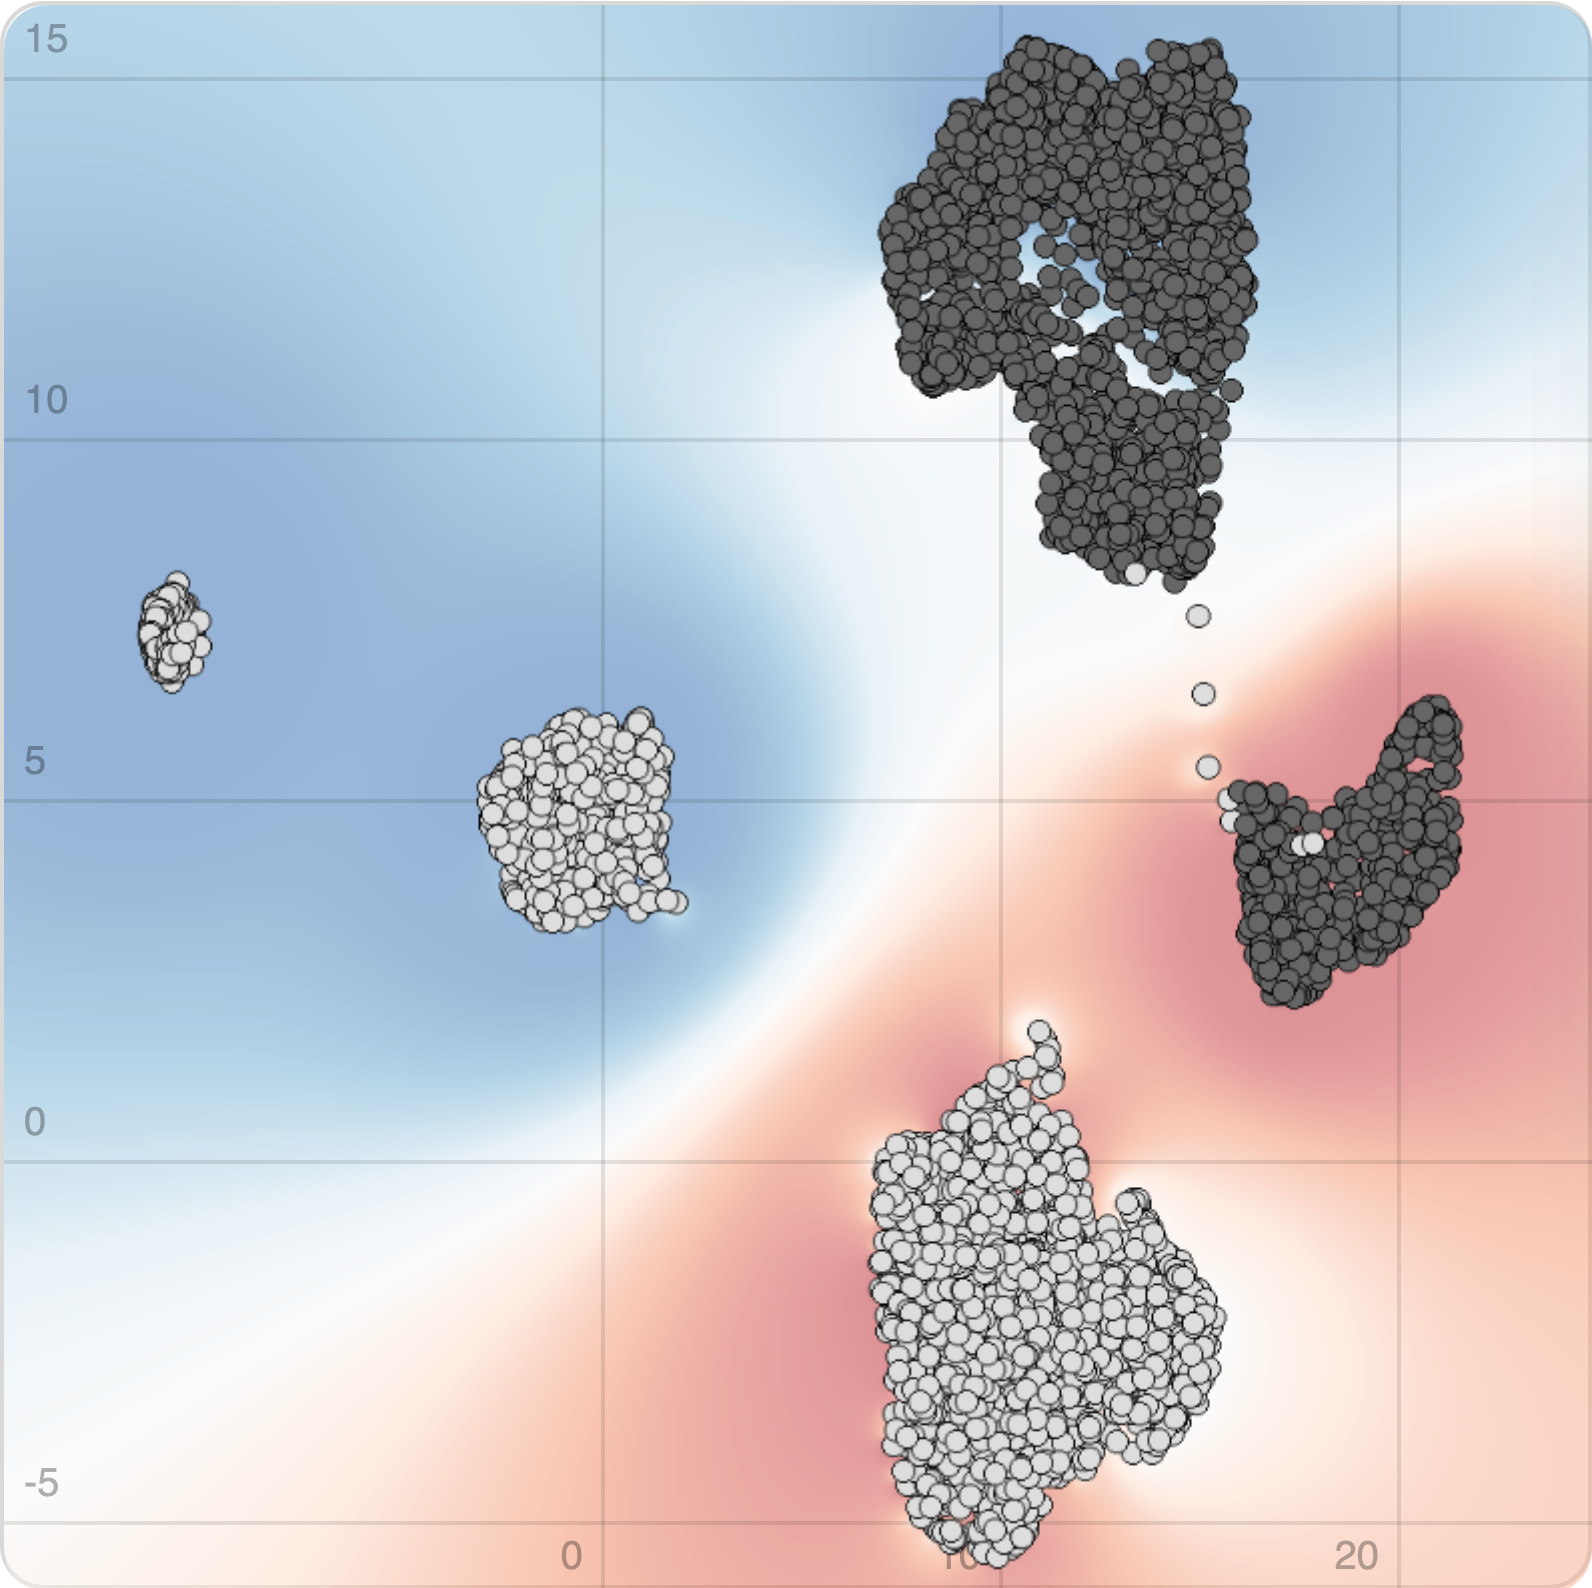
Gradient heat map
A gradient heat map enables seeing how the feature contribution values of a single feature are distributed in the projection space.
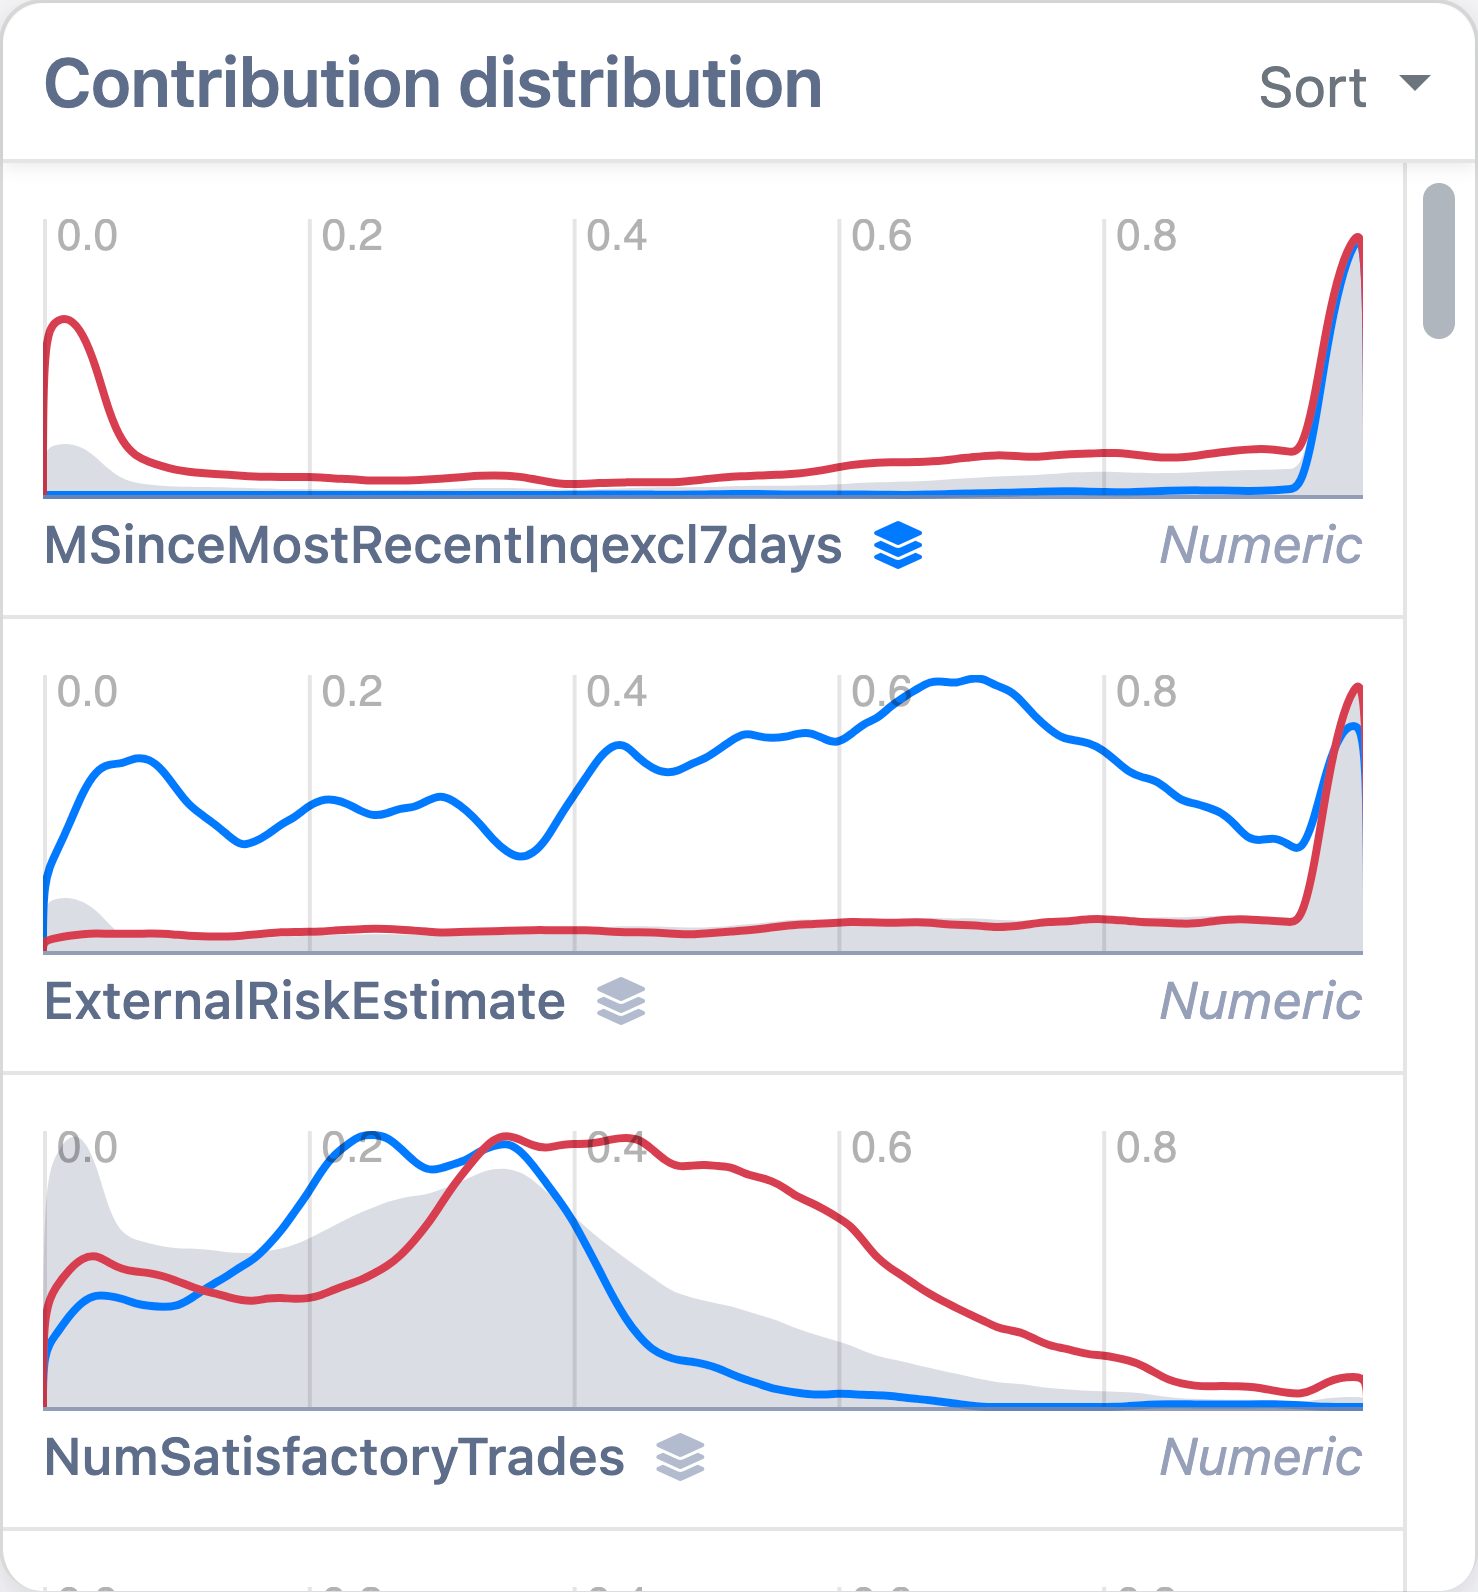
Density plot list
Interactive density plots enable the analysis of clusters in terms of multiple features at a glance.
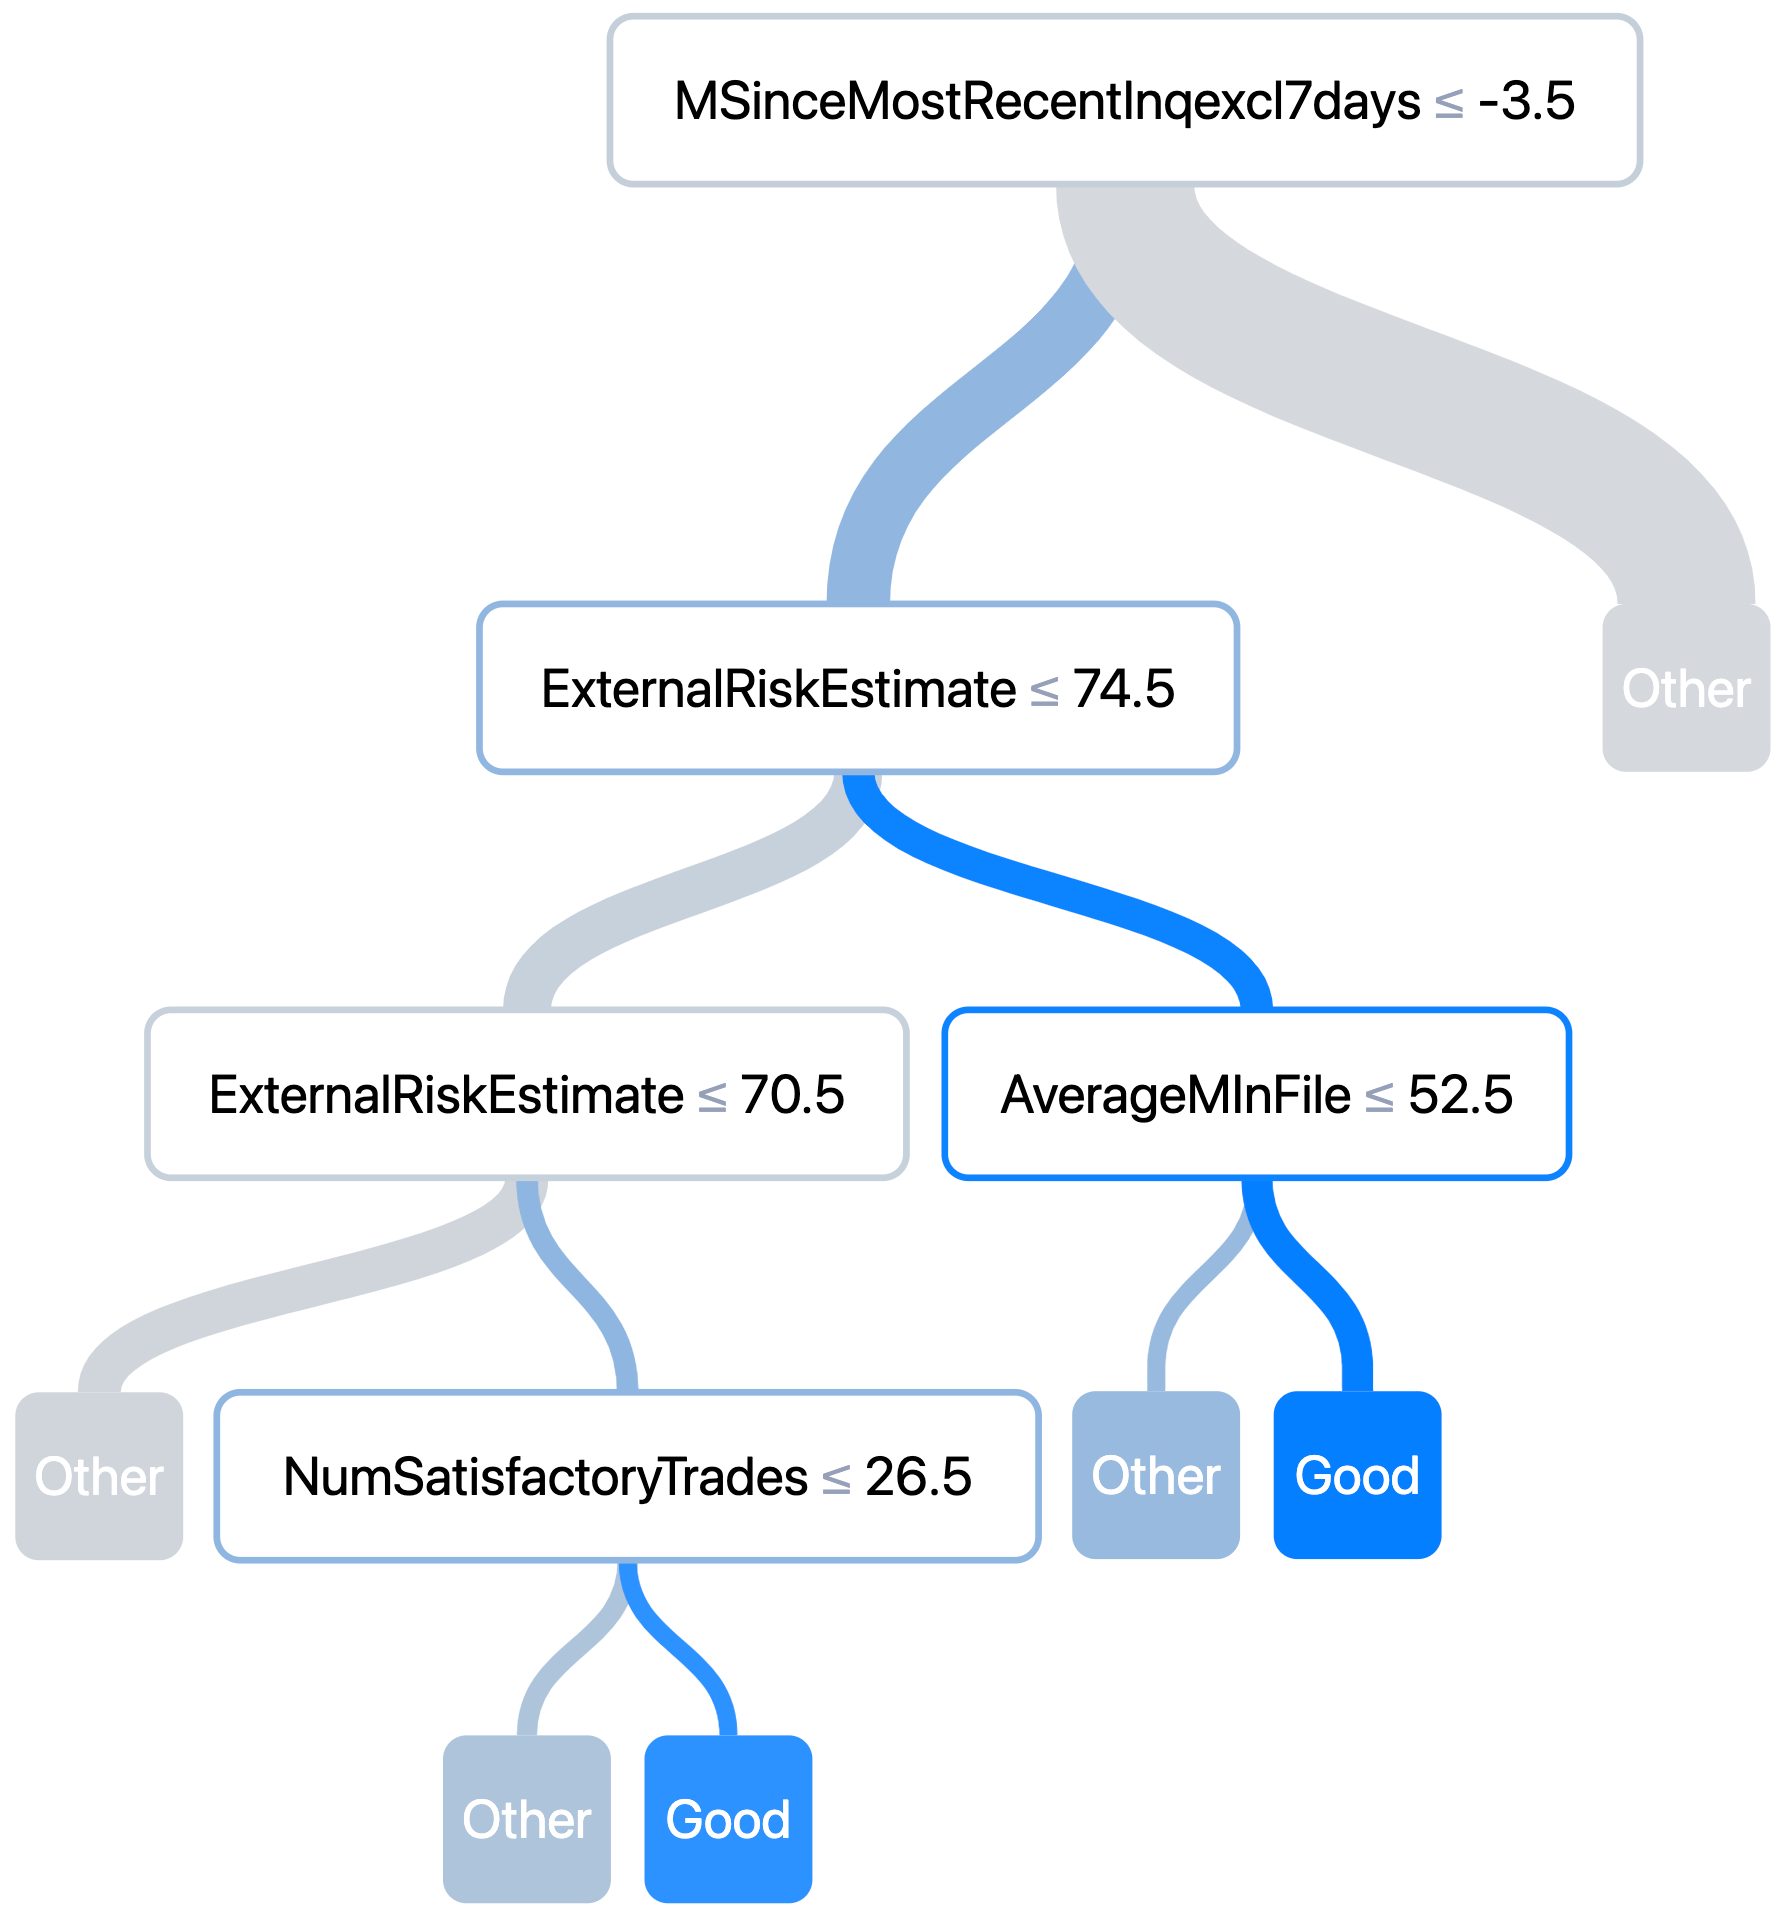
Cluster view
The cluster view helps to understand strategy clusters by representing them as a decision tree (separating the cluster from the other data).
For more information about StrategyAtlas, you can check out the dedicated website (although the content is fairly similar, it contains links to videos and (online) demos), and the paper published in IEEE Transactions on Visualization and Computer Graphics.